Website Tracking
With DataNoodle, website tracking is as easy as falling off a log. eCommerce competitors are constantly optimising their game with new content updates and SEO tactics. We track it all for you so you can keep your head right and your eye on the ball.
As well as competitor tracking, DataNoodle tracks content changes on your own websites, letting you catch site errors and publishing mistakes as they happen. And by integrating your Google Analytics with our eCommerce analytics, you’ll know which changes led to tangible sales and revenue results – and be able to prove it!
Here’s how to set up and use website tracking with DataNoodle.
Content Dashboard overview
After registering an account and setting up your tracked websites, you’ll be able to view your Content Dashboard on the Website tracking tab. This section provides a snapshot of what’s happening inside your Ecosystem. (If you haven’t created an Ecosystem yet, find out how here.)
Here are the different sections of the Content Dashboard and how to use each one.
DATE SELECTOR
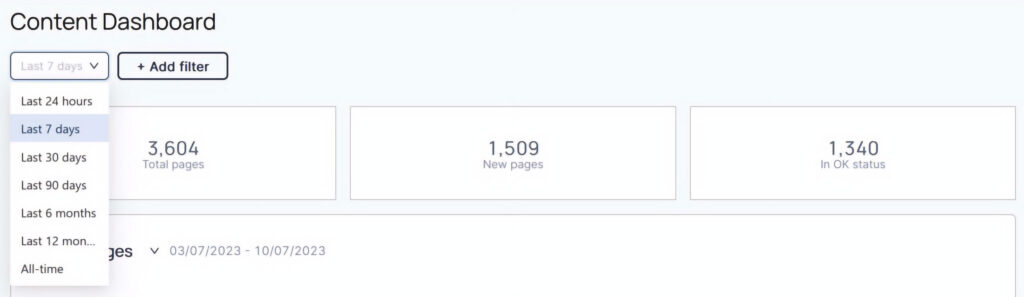
Adjust the date range for your data using the dropdown menu. The date range selected will affect the data displayed on the rest of the page.
Content filters selector

Click the + Add Filter button to apply filters to view data on specific websites tracked within your Ecosystem. For example, you can select just your website, or just your competitors’ websites, or any combination you want.
You can also select one or more vertical tags to filter by data segments of certain pages. For example, if you’re in the furniture industry, you might want to view only the pages tagged as “Beds”.
Here on the Website tracking tab, filtering by a vertical tag like “Beds” will bring up content-specific changes at the HTML level. For instance, if content inside a paragraph <p> or image <img> element is added, updated, or removed.
Whereas if you filter by vertical tags on the Products tab, you’ll see product-specific pricing and availability changes for those tagged products.
Content Scoreboard
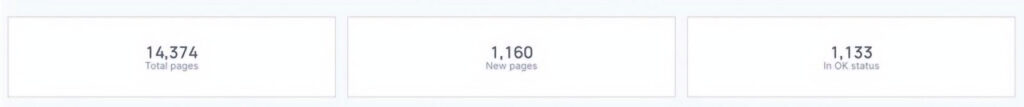
The scoreboard is an overview of three tracked metrics:
- Total pages: All pages DataNoodle has detected and is currently tracking. This is the only figure not affected by the selected date range. It will always display the total number of pages detected within the vertical tag parameters, or for the Ecosystem as a whole if no tags are selected.
- New pages: The number of new pages detected.
- In OK status: All pages with a server status response code of “200 OK”, meaning that the page is successfully loading when requested (is not broken).
Changes & Status graphs
Changes graph

The Changes graph plots the total number of content changes that occurred within your selected date and vertical tag parameters. One page can represent more than one change, for instance if an update pushed multiple changes live on the same page.
Status graph

Use the dropdown menu to switch your view from Changes to Status, and you’ll see another line graph that plots the totals for different server response codes.
This graph displays a separate data line for each HTTP response code identified. Some codes you might see include:
- 200 status: Pages that are “OK”, as in they load successfully upon request.
- 301 status: Pages that redirect to other pages.
- 308 status: Pages that redirect to other pages (similar but technically different to 301, though the end result to the user is the same).
- 403 status: Pages that don’t load because the user doesn’t have permission to view them.
- 404 status: Pages that don’t load because can’t be found (usually happens when a URL has been deleted or changed).
- 502 status: Pages that don’t load because the server refused the request or didn’t respond, or some other error.
This graph is a convenient way to spot real-time errors that are occurring within your own websites, as well as what’s going on with your competitors.
Website Data overview
Underneath the Content Dashboard you’ll find the Website Data table, which is where you can view content changes for individual pages.
Note that the date range and any vertical tags you’ve selected will filter the data shown in the table. You can change these settings back up in the Content Dashboard section.
Table Rows

Click on any data row in the table to open a quick overview of up to the last five days of content changes inside the HTML elements on that page. Click the View Page button to see exactly which elements were changed and where.
DataNoodle tracks all HTML elements. Some that you might see include:
- <title> – The page’s title.
- <description> – The page’s meta description.
- <h1> to <h6> – Headings and subheadings of content sections on the page. Very handy to monitor for SEO purposes.
- <p> – Paragraphs that hold the page’s main text content.
- <img> – Image content on the page.
- <video> – Video content on the page.
- <a> – Anchor text (links) on the page. Another important one for SEO, as link text often features targeted keywords.
You can sort the order of data rows by clicking the up/down arrows next to column headers. The sorting options are:
- Website – Name of website as set up in your Ecosystem (forward or reverse alphabetical).
- Edits – Number of content changes detected (high to low or low to high).
- Status – The page’s HTTP status code meaning (forward or reverse alphabetical).
- Status Code – The page’s HTTP status code (forward or reverse numerical).
- Last crawled – Date that DataNoodle last crawled the page (most or least recent)
- Last edited – Date of the last detected change (most or least recent).
Table Filters
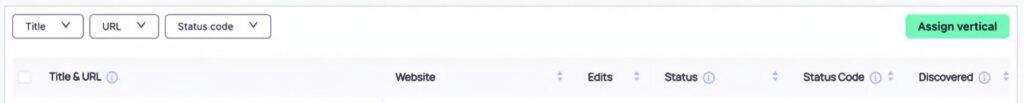
You can apply different search modes to narrow your results by using our advanced filters. To reset a filter after making a search, click the refresh icon beside it.
Title
Title here refers to the meta title of a web page. In Google’s search results, a web page title is shown as the blue link that you click to visit that page. Titles often contain keywords, to increase the chance of appearing in Google’s results for those keyword searches.
You can also see the title of a web page by hovering your mouse over its browser tab. For example, the title for this page you’re on now is “DataNoodle: Website Tracking Tool – Do Data Right”.
- Is – Returns an exact match for the entered page title text.
- Contains – Returns pages with the entered text in any position within the title.
- Starts With – Returns pages with titles that start with the entered text.
- Ends With – Returns pages with titles that end with the entered text.
URL
URL is another term for a web page address. For example, the URL of this page is https://datanoodle.com/features/website-tracking/.
- Is – Returns the result for an exact URL.
- Contains – Returns URLs that partially match the entered text. Can be useful for finding product pages within a certain category. For instance, entering “curtain” could return results like https://examplestore.com/products/blue-and-white-floral-curtains.
- Starts With – Returns URLs that start with the entered text. Note that you must enter the entire beginning of the URL to get results, including the http:// or https:// or www prefixes.
- Ends With – Returns URLs that end with the entered text.
Status and Status Code
The Status Code column shows the HTTP response code for the page, and the Status column defines the code’s meaning. For example, the status code “200” means that the status is “OK”, as in the page is loading successfully.
Ready to take your website tracking to the next level?